Table of Contents
Report Module #
- Reports module consists of detailed reports generated after a successful execution of the test scripts
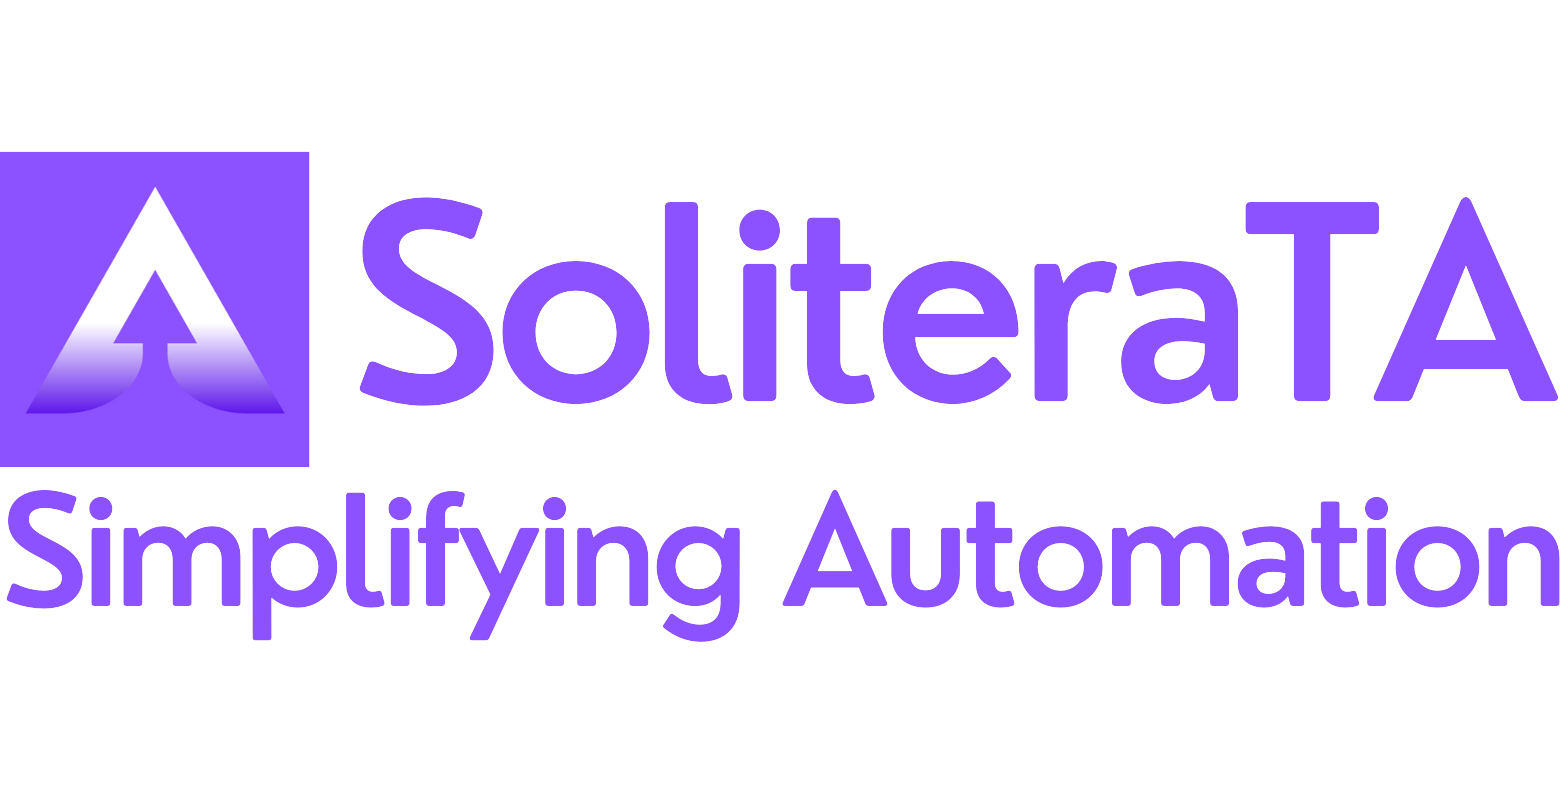
- User can view their report on the report dashboard by clicking on “Go to dashboard” button in these format: Passed report, failed report, pending report
- User can filter their report from the dashboard based on the execution period
- Users can also filter their report by using the filter option available on the release board in these formats: Passed execution,Failed execution, In Progress execution and Pending execution. Report is also available in project structure
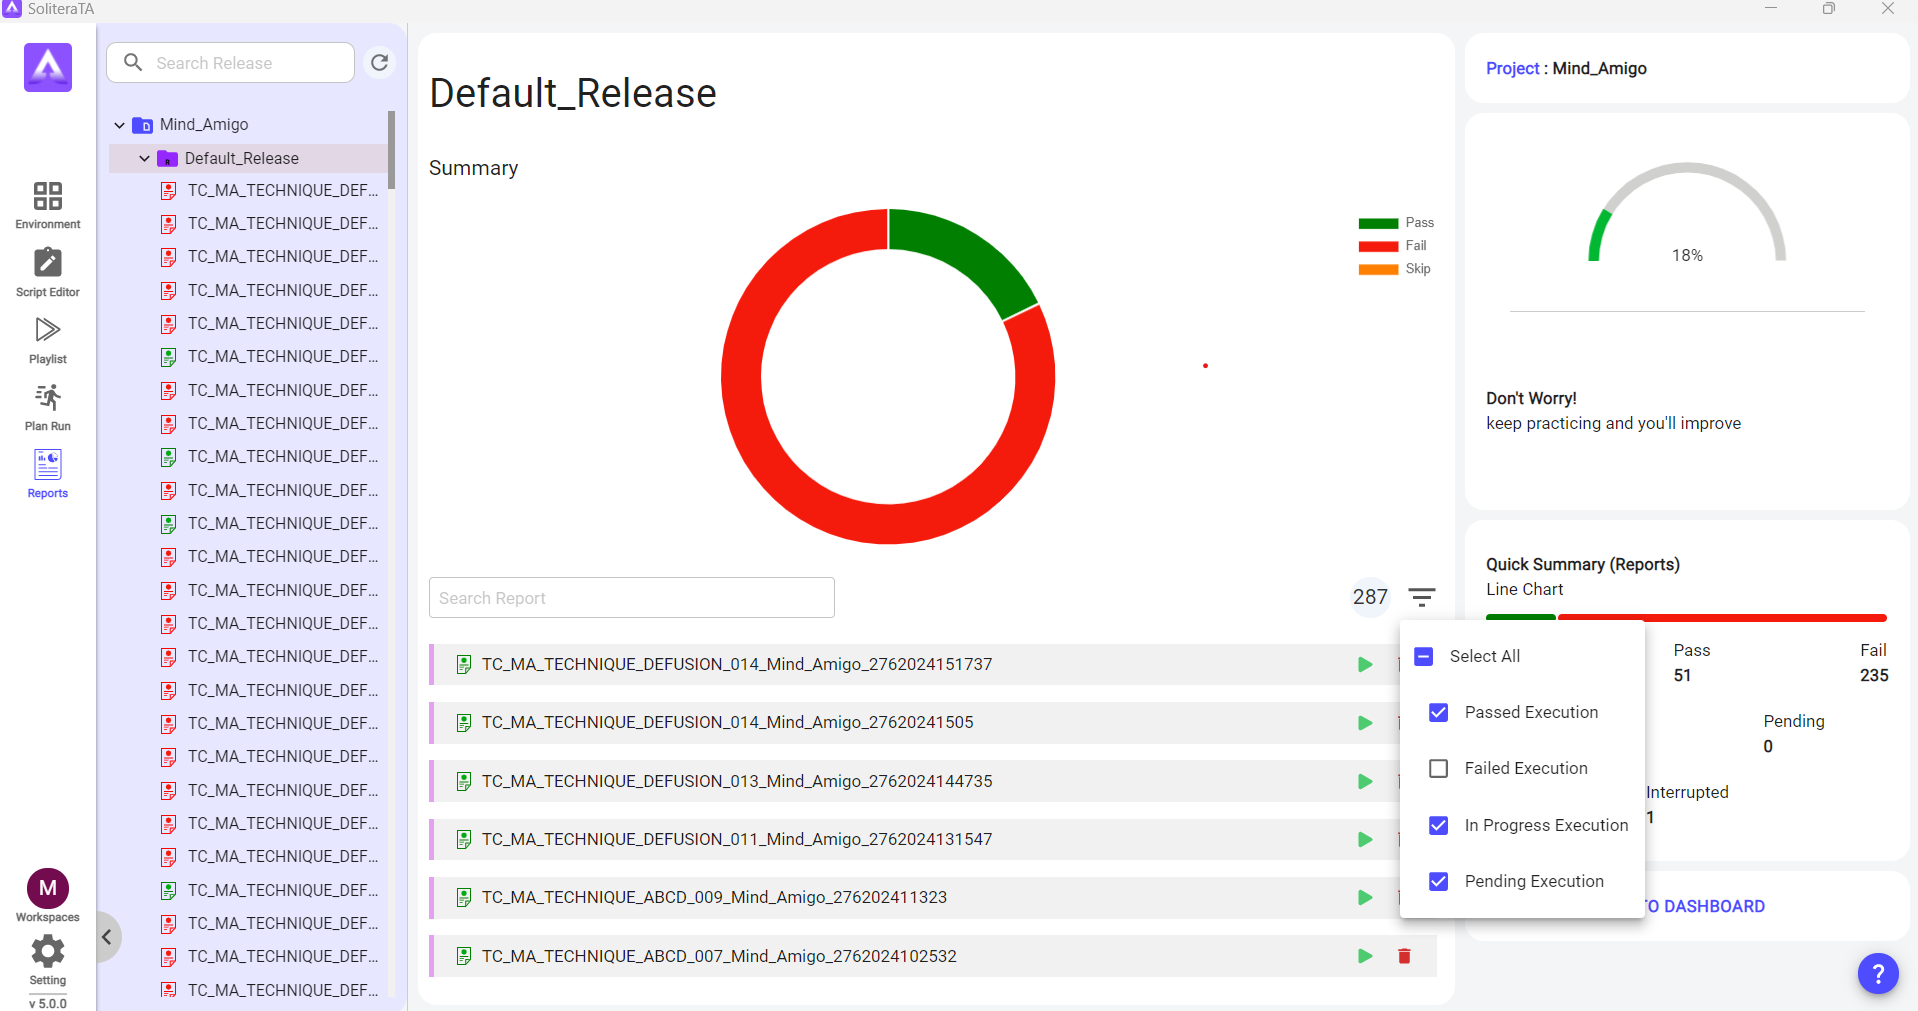
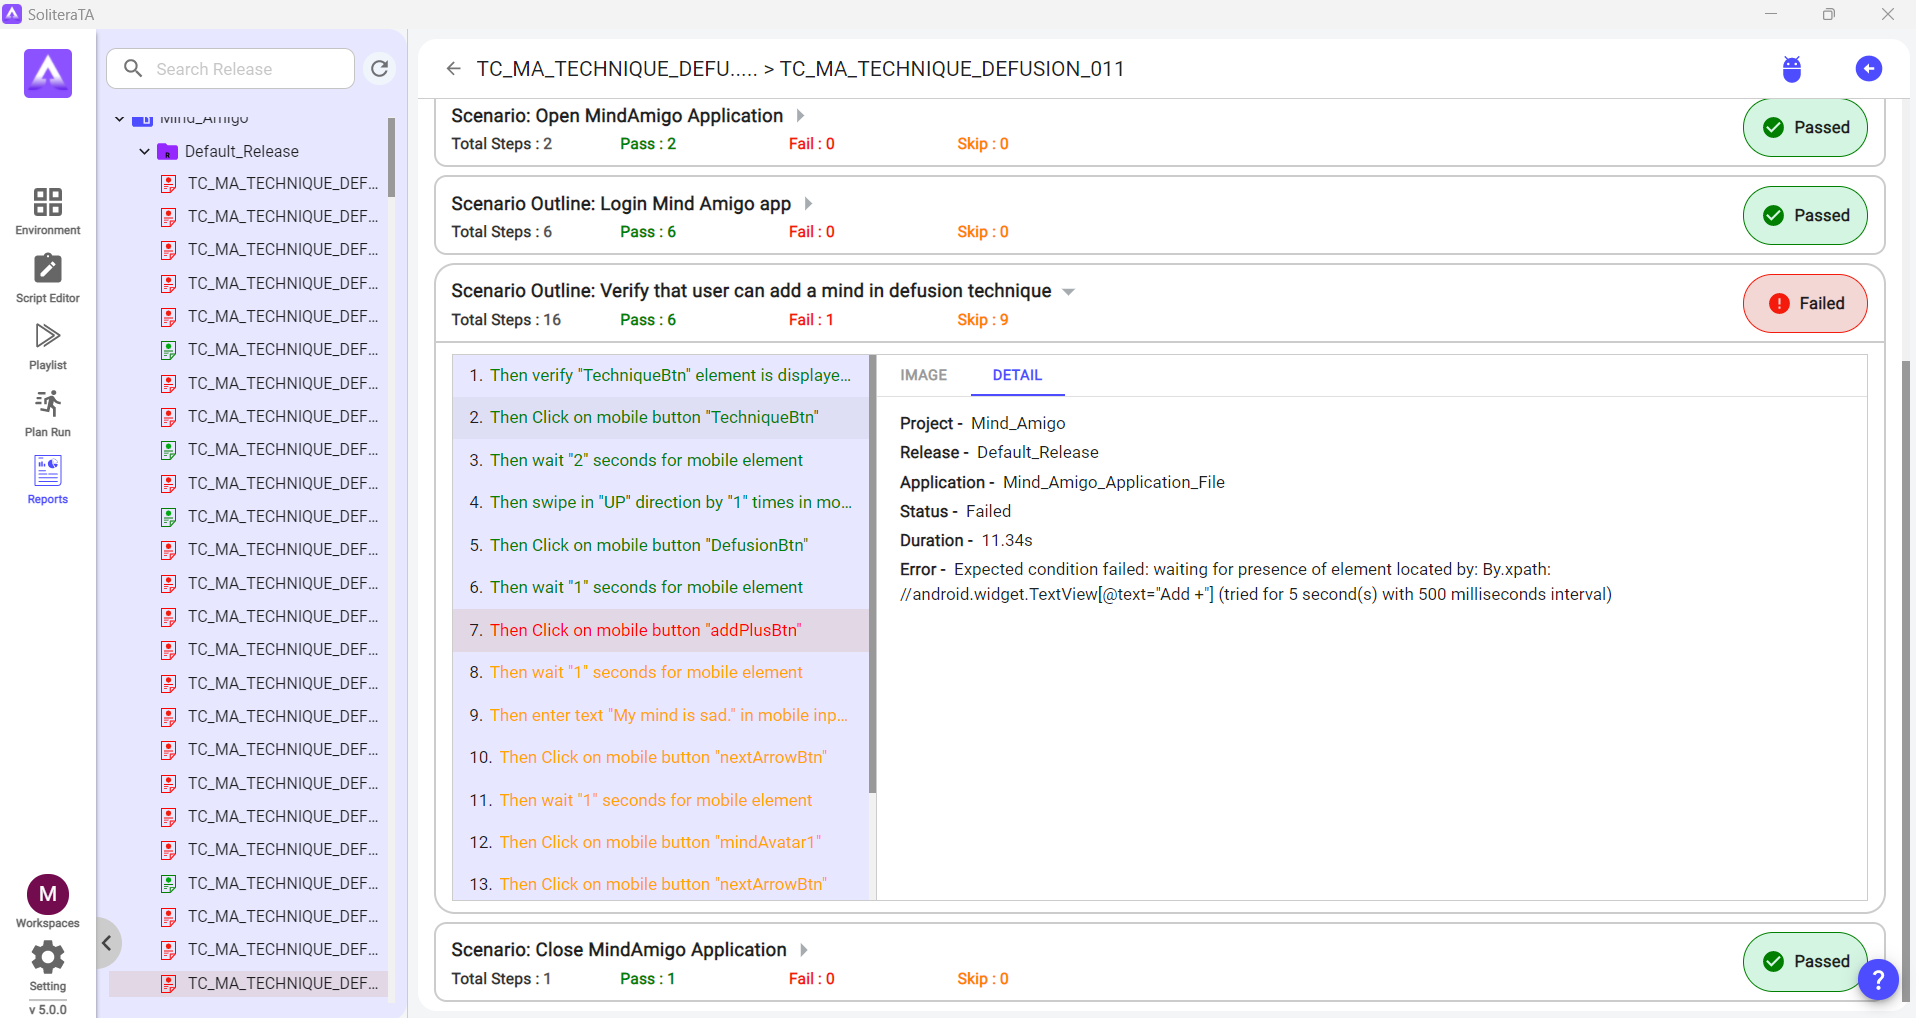
- For each execution a report is generated which gives detailed information of each step for every test script that was run under that execution
- Information is represented in the form of table that consists of test step name its execution time, execution date, status and a screenshot taken at the time of execution
- In the summary section, users can view all the failed and passed script in table format.
- The user can also view the full detail of test execution from the detail section.

- Users can also see the error detail by clicking on the view button in the detail section.
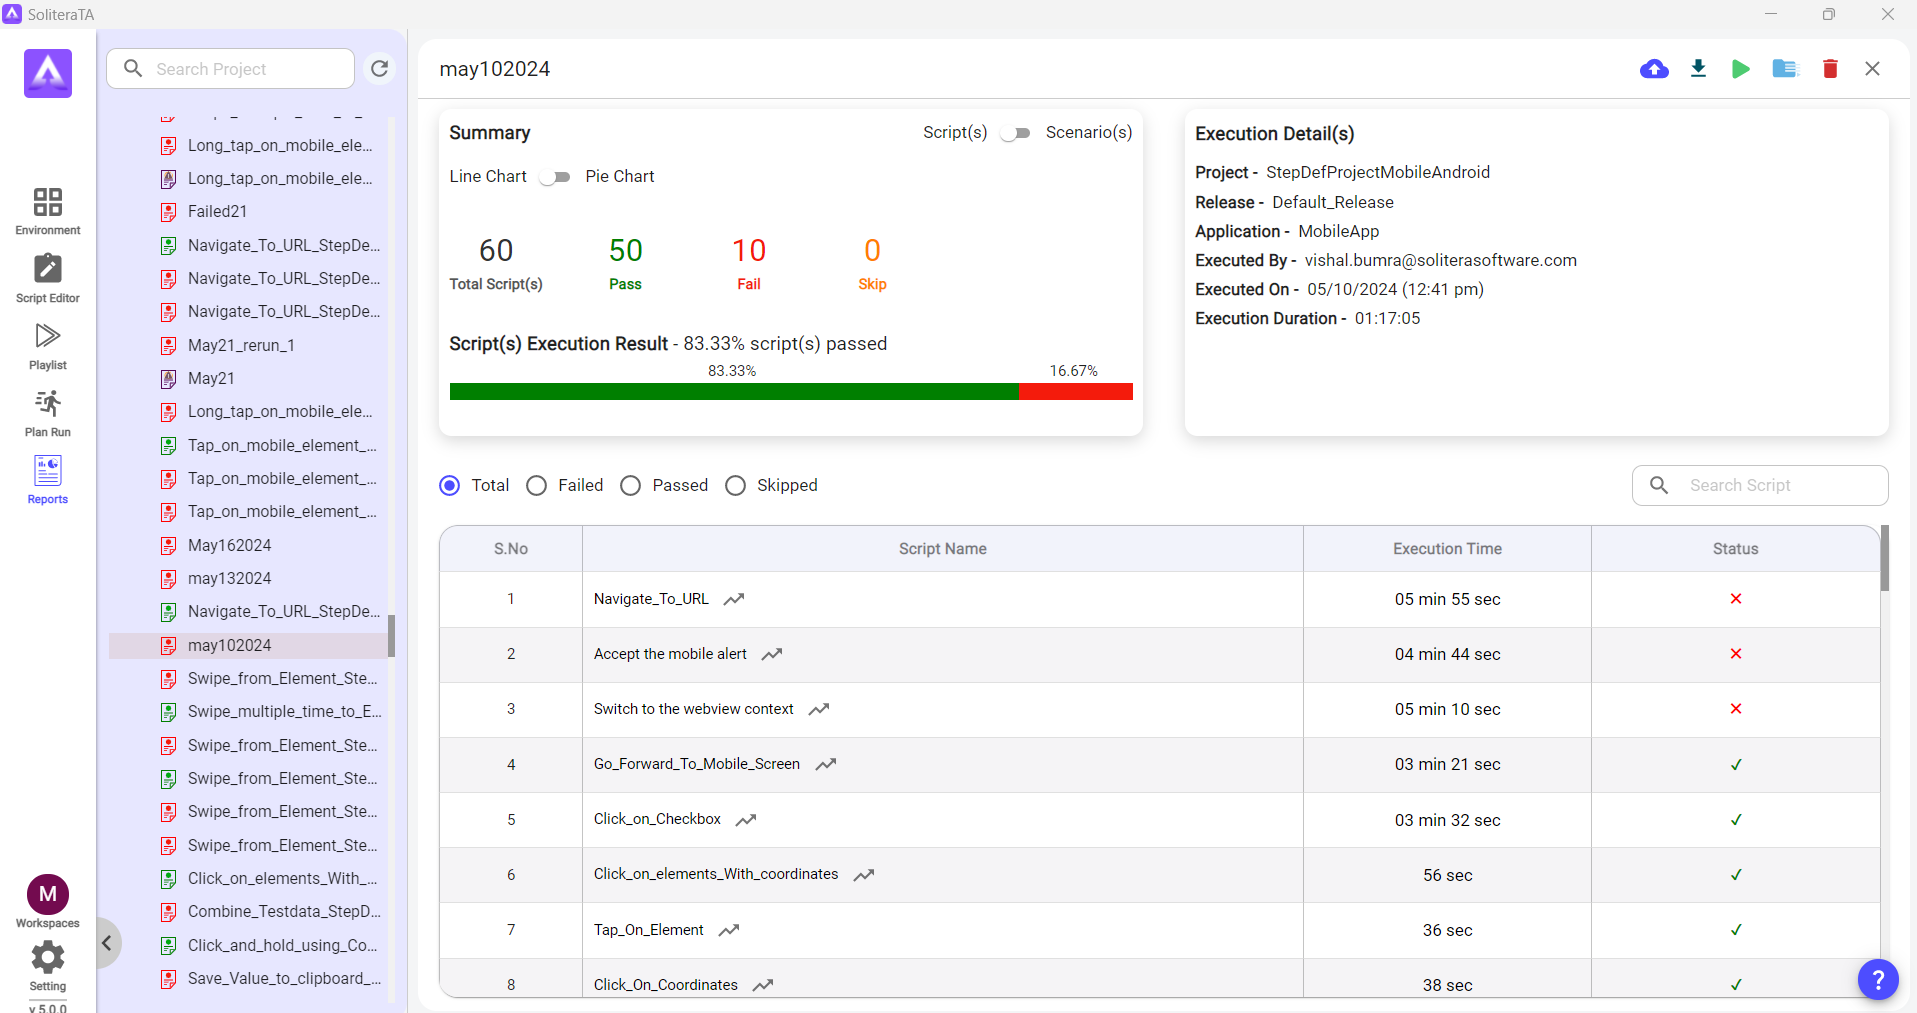
- Users can also re-execute, add to the playlist and delete the report by right clicking on the selected report
- Users can also download and print their report in excel and pdf format
- User can upload their test report on Test Rail by using “Test Managment Result Upload” option available on the top right of the report.
Debug Mode:-
- Debug mode is a feature of the software that enables the developer or tester to facilitate a deeper understanding of its behavior and quick identification of any issues or bugs.
- To enable debug mode in the report, click on the debug icon present on the top right corner of the report.
- Discuss typical scenarios or problems where using debug mode is beneficial, such as
- Troubleshooting specific application errors or crashes.
- Performance tuning by observing detailed performance data and metrics.
- Monitoring application behavior during development to ensure logic is executed as expect


